BUY / RENT

An open-source project journal

A clearer way to make
the housing call.

Buying a home is more than a mortgage payment. These are the numbers, assumptions, and decisions behind Buy or Rent.

Run your own comparison

Look beyond the monthly payment.

The useful question is what you could have at the end of your stay, after selling costs, remaining debt, and the savings you invested along the way.
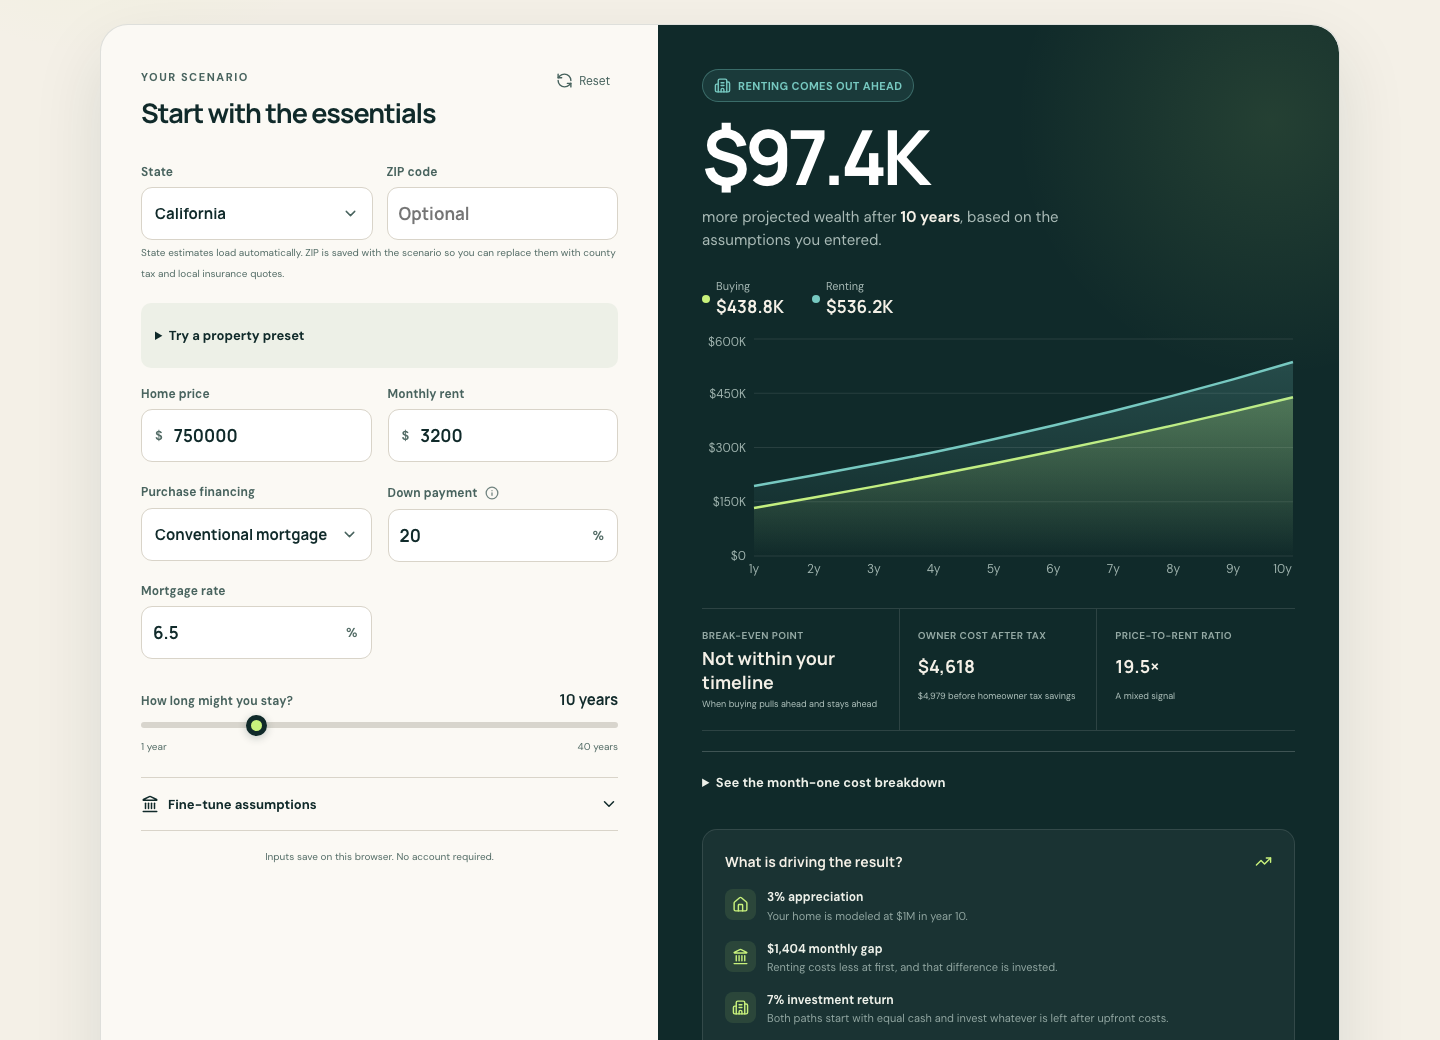
Desktop calculator with editable home price, rent, mortgage inputs, and a projected wealth chart
A fictional starting scenario. Change the inputs to match your own situation.

Buy or Rent compares two paths with the same starting capital. Buying builds equity, but also brings transaction costs, maintenance, insurance, and taxes. Renting leaves capital available to invest. Whichever path costs less each month invests the difference.

The answer depends on your assumptions. A useful calculator makes those assumptions visible.

Three things to change first

  1. The home and the rental. Use properties you would actually consider, with local tax bills and insurance quotes.
  2. How long you might stay. Buying and selling costs matter more over a short horizon.
  3. Your expectations. Try different appreciation, rent-growth, and after-tax investment returns. No single forecast is certain.

The result includes a durable break-even point: the first month after which buying stays ahead through your selected horizon. It is not a promise that buying stays ahead forever.

Read the financial model
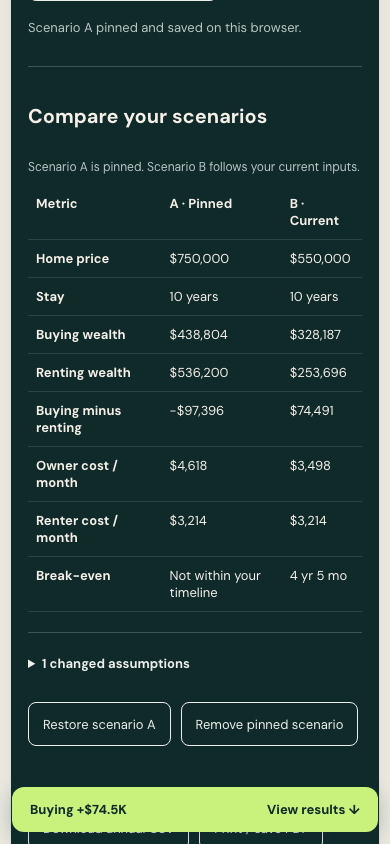
Keep one scenario. Explore another.

Pin a baseline, then change the price, financing, or time horizon without trying to remember the old result.

Scenario A stays pinned in your browser. Scenario B follows your current inputs. Compare projected wealth and monthly costs side by side, inspect changed assumptions, or restore your baseline.

Different stay lengths get an explicit warning because those wealth totals represent different dates.

Also in version 2

  • Month-one cost breakdowns, including principal and interest.
  • Extra principal payments and accelerated payoff estimates.
  • Illustrative house and condo starting values.
  • Annual CSV and printable reports, including partial final years.
  • Grouped advanced inputs and a mobile results shortcut.
Mobile comparison of a pinned $750,000 home scenario with a current $550,000 scenario
Two fictional scenarios, one place to compare.

Your inputs stay in your browser.

No account. No analytics. No scenario database.

The calculator saves current inputs and a pinned scenario in browser-local storage. New shared links put inputs in the URL fragment, which is not sent in the page request. Sharing is explicit: anyone holding a link can read all included inputs, including income and an optional ZIP code. Older query-based links can expose inputs in hosting logs.

This is a planning model, not a lender quote or tax return. State averages are dated starting points; ZIP code does not fetch local quotes. Mixed-use rental tax, depreciation, special assessments, and several other details need separate consideration.

The source, tests, and model documentation are public under the MIT license. Contributions and reproducible bug reports are welcome through the repository.

Make the assumptions yours.

Start with the essentials, then open the details that matter to your decision.

Open the live calculator